There are two broad types of statistics: Descriptive and Inferential. Descriptive statistics basically refers to a summary of a given data set. It can take the form of concepts like measures of central tendency (Mean, Median and Mode) or Measure of spread ( Standard deviation, Variance, Mean Absolute Deviation, etc.). Inferential statistics has to do with forming and testing hypotheses. It is heavily used in empirical research.
Now, if you are still reading this article, then you might be interested in what is coming next. So, as it happens, I got the hand of data of Nepal stock exchange a couple of days ago. As is the usual process before analyzing any data set, I began to filter and improve the data quality. Finally, the boring part was over and I started writing some basic codes in R. By the way, if you are interested in checking the R modules, I will attach a link to my GitHub page down below this article. After a while, the interesting findings were out and today, I am going to share those findings with you. So, Let’s start..!
As you might know, NEPSE is a market cap-weighted index that includes all the public companies operating in Nepal. It has been around for more than 20 years at this point. Now, you tell me, have you ever asked what is the compounded annual rate of return of the overall index? What would be the risk that an investor might face on any given day when he/she decides to invest in NEPSE? Now, you might be thinking, what is this guy talking about? How on the earth can I invest in NEPSE? If you have this question, that’s a completely valid question and the answer lies in the idea of indexation.
I need you to imagine a mutual fund that tracks the NEPSE very nicely. It means whatever happens in the NEPSE index, the fund’s portfolio will exactly mimic those returns/risks. Until now, there are no such products for investors in our market. However, just for the sake of this explanation, I need you to remember that there is a mutual fund that can give you complete exposure to the overall market.
Now that is clear, let’s go ahead and see the following table:
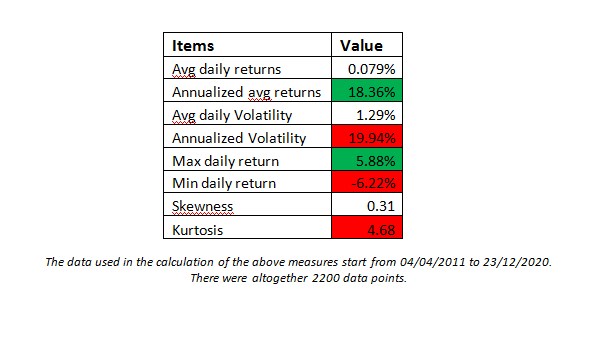
Let’s start interpreting the above data in the table. First, we have average daily return which is 0.079 %. This means that on any given day, you can expect 0.079% from the index mutual fund that you had invested. Now, you might ask me, “wait a minute, NEPSE was up by 3% today which of course is way more than a mere 0.079%. So, what’s going on here?”. Well, the answer lies in the definition of the mean itself. When you are calculating an average or mean of certain data points, you are taking all the data points, summing them up, and dividing them with the total number of data points. If you read the earlier lines carefully, you might have noticed I used the term “on any given day”. That’s the key behind mean.
Well, the daily return is not much of use unless you convert it into an annual term. Hence, we come to our second measure and that is Annualized average returns(18.36%). I am pretty sure this will pique your interest. This basically tells us that if you had invested in the fund in 2011 and just held it through ups and downs, you would be earning a 18.36% of compounded annual rate of return. That’s massive, to say the least. Long term investing always is the key, do not forget that. Next, we move from the space of returns to risk. Never forget risk. Always think in terms of risk-reward ratios and you shall be a better investor. Volatility, in its simplest form, can be described as how much are the returns moving in relation to the mean returns. Here, we use standard deviations to track our volatility.
The average daily standard deviation of NEPSE is 1.29%. This means on any given day you should prepare yourself to see a fluctuation of 1.29% in the market and since you are holding a fund which tracks the NEPSE index, your portfolio is fluctuating by that amount as well. I don’t know if you have already noticed but that’s huge volatility for any give day which means substantial risks. Just compare this figure with the avg. daily returns(0.079%) and you will get the sense of how things are shaped. Similarly, the annualized avg volatility in NEPSE turns out to be around 18%. If that’s not risk, what is, right ?!
The next two figures in line, we have maximum and minimum daily returns which I think is pretty much self-explanatory. Its just saying the highest returns during the examined period (c.a. from 2011 to 2020) was 5.88% and the biggest drawdown was -6.22%.
For the next two measures, I am going to explain them using a visualization. The following is a histogram of the daily returns of NEPSE for the past 10 years (well, almost):
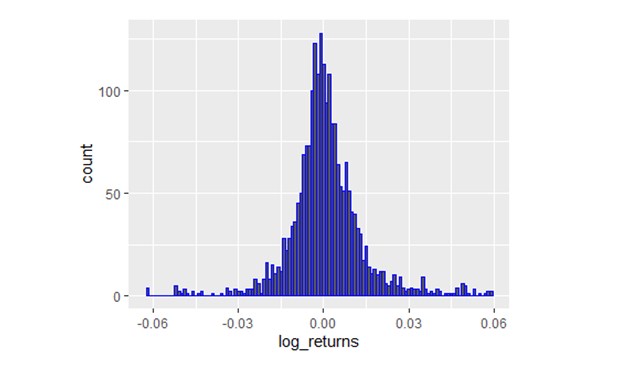
The above you see is a histogram in which each bin represents 0.01% of returns. Now, if you have taken any introductory stat class or just are interested in statistics in general, you might be familiar with the concept of bell curves and normal distribution. Well, to put long story short, the returns depicted by the NEPSE do not really portray signs of normal distribution since you can see the tails extending very far from the mean and certainly way past 3 standard deviation, which by the way is the limit of normal distribution. Anyways, I don’t intend to start a stat class here, so lets move on to skewness and kurtosis.
Skewness simply is the measure of symmetry. In other words, if you look at the above histogram, you can see that the data does look pretty much symmetric which means it is not tilted too much on either left or right side (Negatively or positively skewed). This exact phenomenon is explained by the skewness measure of 0.31 that we have in the table. Finally, we have kurtosis which has lot do with tail events. Simply put, the greater the kurtosis, the more is the probability of extreme events happening in the market. The extreme events can be on both sides, up and down. Look at the above histogram, you shall see that there are large events happening at the tails more than couple of times. Not surprisingly, NEPSE has a kurtosis of 4.68.
So, you might be asking now, how is this going to help me in making my investment decision process? Well, you can look at these measures and figure out whether you are comfortable enough in holding your positions and keeping your emotions check when the market goes through the turbulent times. If you are investor in a mutual funds right now, you can measure their annual performance with the NEPSE’s performance and examine whether the fees you are paying for active management is worth it or not.
I had tons more to write but this article is getting too long now. So, I have to conclude this here. In the next article, I shall be providing you with results and finding from sub- indices such as Banking, Insurance etc. Furthermore, we shall be checking out what happens to different investment strategies when it is back tested with historical data? Stay tuned…!
Bivek Neupane is a MSc. Finance and Economics student. He is also a CFA candidate. He is specializing in quantitative finance and research. His other interests include Portfolio optimization, Behavioral finance, Alternative asset management etc. Connect with him via LinkedIn (https://www.linkedin.com/in/bivek-neupane-6478b9177/).Check out his GitHub page if you want to access the R modules (https://github.com/biv-neupane7/NEPSE-stat-analysis).