Of course, I have the findings of all the sectors but things are getting repetitive now and it’s not that fun anymore. So, that’s why, I shall be just putting those data on my GitHub page. However, there is something very interesting that I want to share it with you. The word is “Correlation”. Think about it, what is correlation? You can think very intuitively, and ask this question, “If there are bunch of stocks trading in the market, Is there any correlation between these stocks?” i.e. If Stock A increases by 10 %, what happens to stock B? Does it also increase by 10%? Or Does it decrease or stay neutral? So, today we shall be trying to answer these questions by checking out the historical data from last 10 years. In our study, we shall be examining the relationship between NEPSE and its sub-indices.
Alright enough chit-chat, lets jump straight to the point.
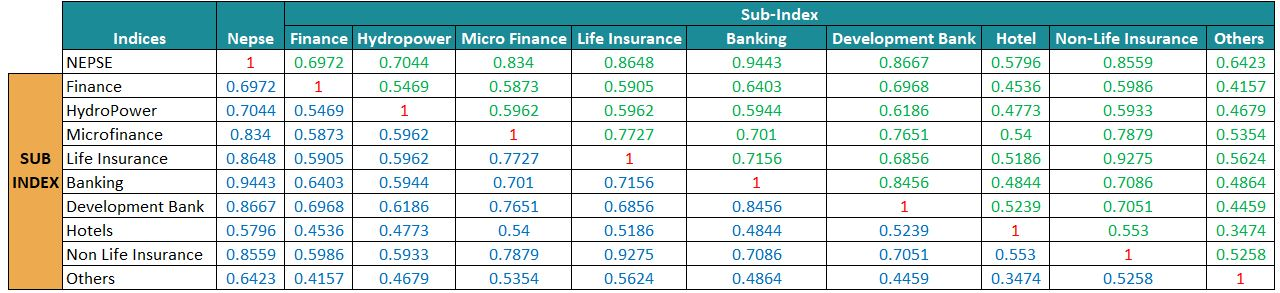
I guess you are now asking, how should I read this table? A very good question. It might be a little intimidating at first to look at all those numbers but it is actually very very simple. Again I would like remind you what we are looking. Suppose, we are asking the question, “How much is the correlation between NEPSE and Commercial banking sector?” Or in other words, If NEPSE goes up by 5 %, by how many percentage points the Banking sector is going to change? I shall help you answer this question in following steps:
Step 1: Identify your question. In our case, we are looking at the relationship between performance of NEPSE and Commercial banks
Step 2:Look at the table and locate the two entities. You can see above that in the very first column i.e “Indices” column, in the 1st row, there is “Nepse Index”. That’s one. Now, locate commercial bank. Look at the 6th column with the column name of “Banking Index”.
Step 3: Now, time to find the correlation ! So, as you can see, in the 1st row in the “Banking Index” column, it states the number 0.9443. That’s our correlation between NEPSE and Commercial banks
Yeah, But what do those numbers mean…?
Again, I would like to emphasize the meaning of this number. This number basically means that if Nepse goes up/down by 1%, commercial banks would go up/down by 0.94%. What do you think this indicates? This indicates that these two entities have strong positive correlation. Does this mean that anytime Nepse changes by 1 %, commercial banks have to change by 0.94%? Hell no..!
Correlation does not equal causation. This is the fundamental rule that every introductory statistics class teaches and it is very integral in interpreting the findings. The 0.94% is a historical correlation. More than 2500 data points have been observed to come up with that result. So, essentially it is “historical” correlation which means you can expect this correlation in years to come in the long run but don’t expect the commercial banks to change 0.94% if Nepse changes by 1% tomorrow.
Many ways to look at the table
Look at the table properly, you shall see green , blue and red colors. These colors do not signify anything other than they are used here to simplify my explanation to you. So, another way to look at the table and come up with the same correlation of 0.94% is by looking at the blue part of the table. Last time we had looked into the green part. In this case, I need you to look at the 2nd column named “Nepse Index”. There you shall see bunch of numbers that starts with 1 at the 1st row. Now, check out the 1st column named “Indices” and locate the “Banking Index”. And, there you have it, the number again is the same 0.9443. Like I said, it’s the same number but just the way of looking is different.
And what’s the deal with 1? Well, there is 1 because if the asset is compared to itself, obviously it will have the correlation of 100 %. Hence, correlation of 1.In this article, I explained the relationship between just two entities, but as you can see above, you can put any two combination and come up with a historical correlation.
Now, if you are focusing on what I am saying here, you might have already realized by looking at the table that the green and the blue part are actually an exact mirror reflection of each other. Look properly, and you will find the same numbers on the both sides, just in different places.
But why is correlation important?
It is important because correlation among the different securities will determine your risks and returns that your portfolio will bring to you. I am going to start a new series of articles on portfolio management and I shall be explaining more in-depth about the importance of correlation. But, essentially, our goal should be to hold those securities which have very less correlation with each other. Well, the ideal would to hold securities which are negatively correlated but it is almost impossible to find those. I shall be explaining a lot about these topics in future. Stay tuned…!
Bivek Neupane is a MSc. Finance and Economics student. He is also a CFA candidate. He is specializing in quantitative finance and research. His other interests include Portfolio optimization, Behavioral finance, Alternative asset management etc. Connect with him via LinkedIn (https://www.linkedin.com/in/bivek-neupane-6478b9177/). Check out his GitHub page if you want to access the R modules (https://github.com/biv-neupane7/NEPSE-stat-analysis).