Some of you might be veterans in this business and some of you guys might be just getting your feet wet. Regardless of your experience in the markets, I think this article will provide you some knowledge about myths, fiction and facts of an iconic trading strategy. Today, we are going to talk about a strategy that has been around for many decades. It is one of the most simplest trading strategies around. If you are trading in the market, I bet you have surely come across this strategy at least once. The name of the strategy is the Moving Average Crossover Strategy.
Q) What is MA Crossover strategy?
The basic idea here is that we are taking 2 sets of moving averages and building buy and sell signals using these 2 MAs. For example, one of the most common sets of MA strategy involves using 20 Day EMA/SMA vs 50 Day EMA/SMA. EMA stands for Exponential Moving Average and SMA stands for Simple Moving Average. Which form of MA you use is not an issue. The difference is very miniscule. Therefore, you don’t have to worry about deciding between EMA and SMA. For our study purpose, we choose SMA.
So, the strategy looks like this:
- If the 20 Day SMA crosses the 50 Day SMA (from below), we buy.
- If the 50 Day SMA crosses the 20 Day SMA (from above), we sell.
If I had to use Mr. Bings’s words, I would go, “Could that strategy be any simpler?”
Q) How will we test this strategy?
The empirical research in finance and economics usually happens with historical data. We are going to follow a similar procedures and conduct a back-test in the historical data of NEPSE that spans back to 1997. So, the basic idea is that we shall be using the MA crossover strategy in the sample period and check whether this strategy generates positive returns or not. Our dataset spans from 1997-07-20 to 2020-12-23. It contains 5369 daily observations. This is pretty sufficient amount of data to conduct a brief study such as this.
Also, I have to mention the caveat, like in the other articles I have written in the past, that we are assuming that there is an index fund that tracks the NEPSE index and we are trading that funds in the market.
Q) Do we have some charts and visualization that aid our understanding?
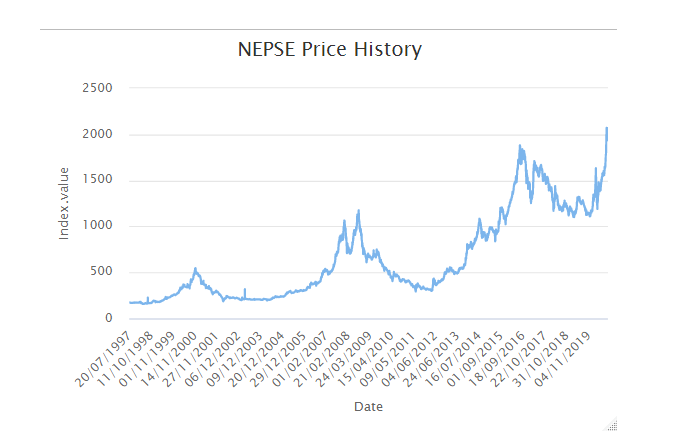
Sure, after all as they say, A picture is worth more than thousand words. Below is the price history of NEPSE. We can see the general long term uptrend in the market. We can also see some boom and bust periods in the chart.
Next, we are going to add the 20 and 50 Day Simple Moving Averages into the mix.
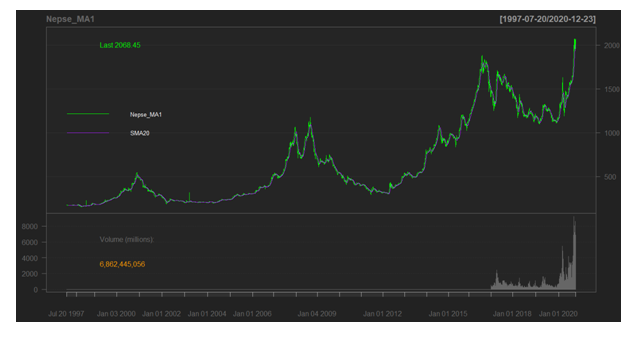
The above graph consists of NEPSE and SMA 20. Those two are indicated by their respective colors: green for NEPSE and purple for SMA 20.
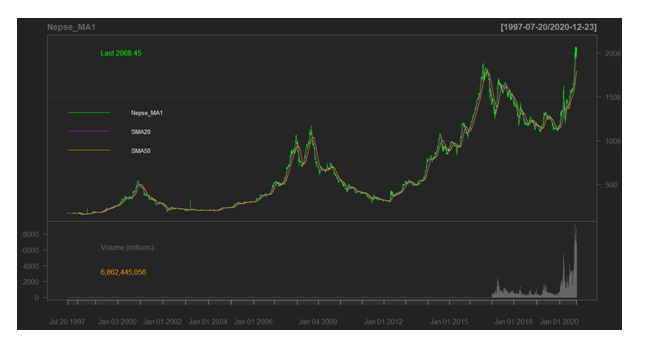
Next, we have all the three price lines included in 1 graph below. The SMA 50 is denoted by Orange color. I know that it might be a bit difficult for you guys to see it but just bear with me, the good stuff is coming soon.
And just and FYI, while looking at this chart, ignore the volume section. There is a glitch in the code that I am not able to figure out. Just look at the price section of the graph.
Q) Can we see the returns produced by the “MA crossover strategy” vs “Buy and hold strategy”?
The “Buy and hold strategy” serves as a perfect benchmark to compare any strategies. The reason being it is very cost-efficient and simple to implement. In our case, the question would be which is better: Buying and holding NEPSE index forever or using MA strategy? The following graph contains three sections: Cumulative return, Daily return and Drawdown.
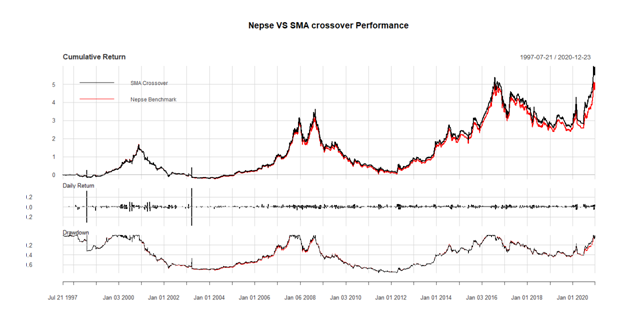
Cumulative return means how much returns you would generate until now cumulatively. In other words, it gives you the total amount of return. Daily return is self-explanatory. Drawdown simply means how much did you lose when the strategy was working against you compared with the benchmark (NEPSE/ Buy and hold).
Perhaps, the main finding is here:
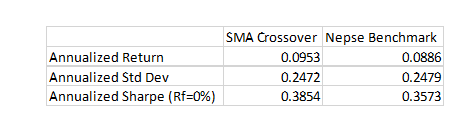 The Annualized return is the compounded returns on your investment. The standard deviation serves as a measure of risk. Sharpe Ratio, often known as risk adjusted return, basically is telling you how much extra return are you generating per unit of added risk. The larger the number, the better is your strategy.
So, lets look at the numbers. The SMA Crossover strategy actually beats the Benchmark by 0.67 %. Not by a large number, but still it beats. The risk we face in both of these strategies is basically the same. And since the returns are a bit higher for SMA Crossover, not surprisingly it has higher Sharpe ratio. So, what do we conclude from this? Is the MA strategy better? Well, the answer might not be that straight forward. I say that because of other variables that come into play while implementing such trading strategies.
In this study, I have completely ignored the transaction costs and tax expenses. If I had included these two factors in the study, I am pretty sure the annualized return from SMA crossover strategy would be well below Buy and Hold. Next, the standard deviation will not be the same as Buy and Hold if I had used individual security like NABIL bank or any other company. This is sole because the individual stocks are way more volatile than the whole aggregate index. Furthermore, the strategies like MA crossover fall into the category of momentum strategy which means these strategies work when markets are trending. If the markets are choppy and going side-ways, then you are bound to lose money. This kind of strategy fails to generate any returns. Hence, the reason why I used last 20 years of data.
Considering all these hassles and lower returns that the strategy generates, I wonder how many of you actually think that this simple strategy will make money for you in the long run.
Bivek Neupane is a MSc. Finance and Economics student. He is also a CFA candidate. He is specializing in quantitative finance and research. His other interests include Portfolio optimization, Behavioral finance, Alternative asset management etc. Connect with him via LinkedIn (https://www.linkedin.com/in/bivek-neupane-6478b9177/). If you have any questions regarding anything Investment and finance, do not hesitate to send him an email or text in LinkedIn. Check out his GitHub page if you want to access the R modules (https://github.com/biv-neupane7/NEPSE-stat-analysis).