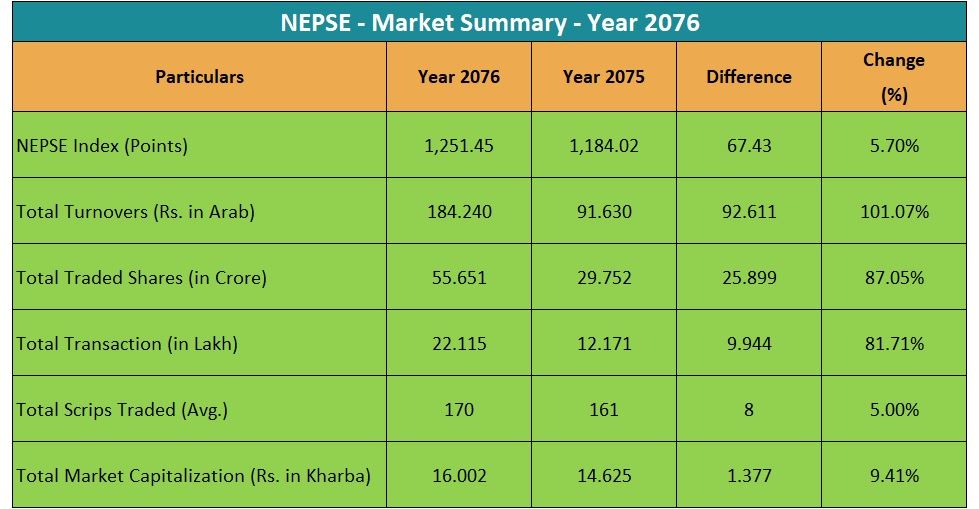
In the last year, market capitalization has increased by 9.41 percent or by Rs 137 billion to Rs 1600 billion. In the ending of the previous FY, the market capitalization was Rs 1462 billion. Compared to the previous year, the total share transaction amount also increased by 100 percent and number of shares increased by 87 percent. In the last year, the average daily transaction remained at 170 companies. In the year, a total of 556.5 million units of shares were traded 2,211,000 times for Rs 100.84 billion.
In the previous year, the average traded company remained at 161 while a total of 297.5 million units of shares were traded 1,217,000 times for Rs 91.63 billion.
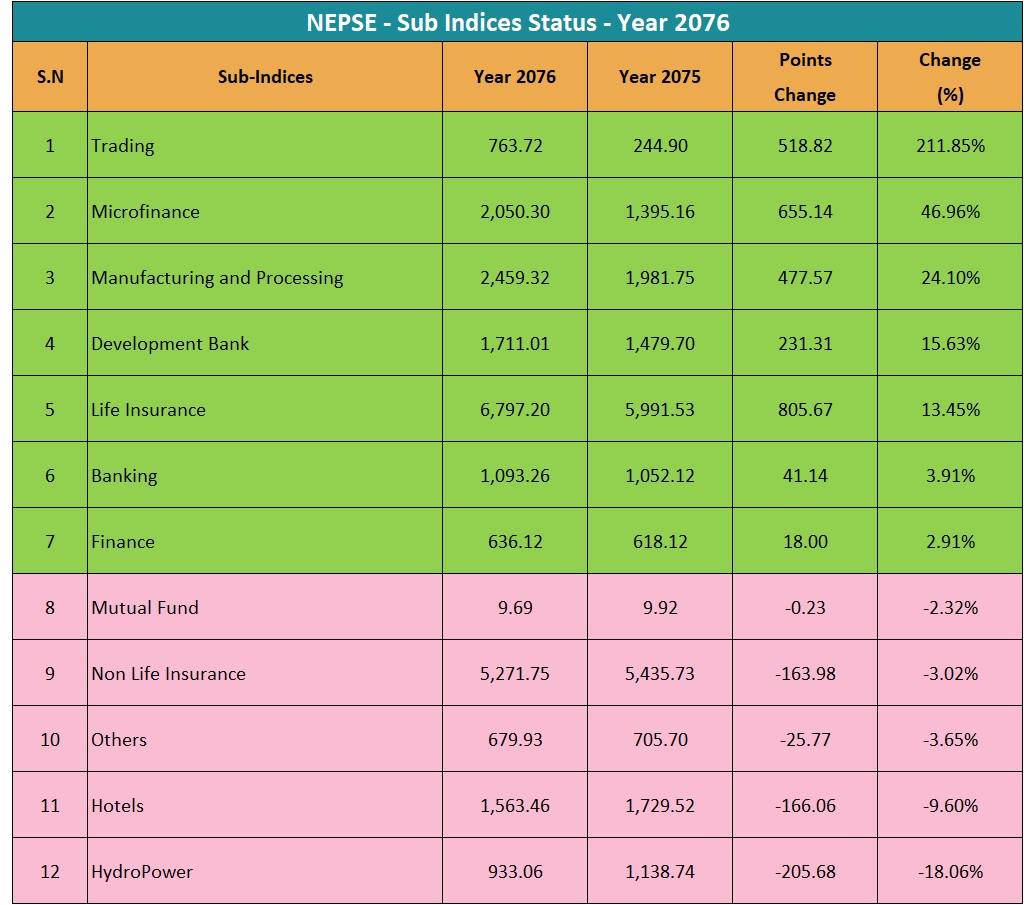
In the last year, out of 12 sub groups indices of 7 groups have increased while 5 have decreased. During the period, trading group increased the highest by 211.85 percent. Similarly, index of microfinance group increased 46.96 percent, manufacturing group increased 24.10 percent, development bank increased 15.63 percent, life insurance increased 13.45 percent, banking 3.91 percent and finance increased by 2.91 percent.
Meanwhile, hydropower group decreased 18.06 percent, hotel decreased by 9.60 percent, other 3.65 percent, general insurance 3.03 percent and mutual fund decreased by 2.32 percent.
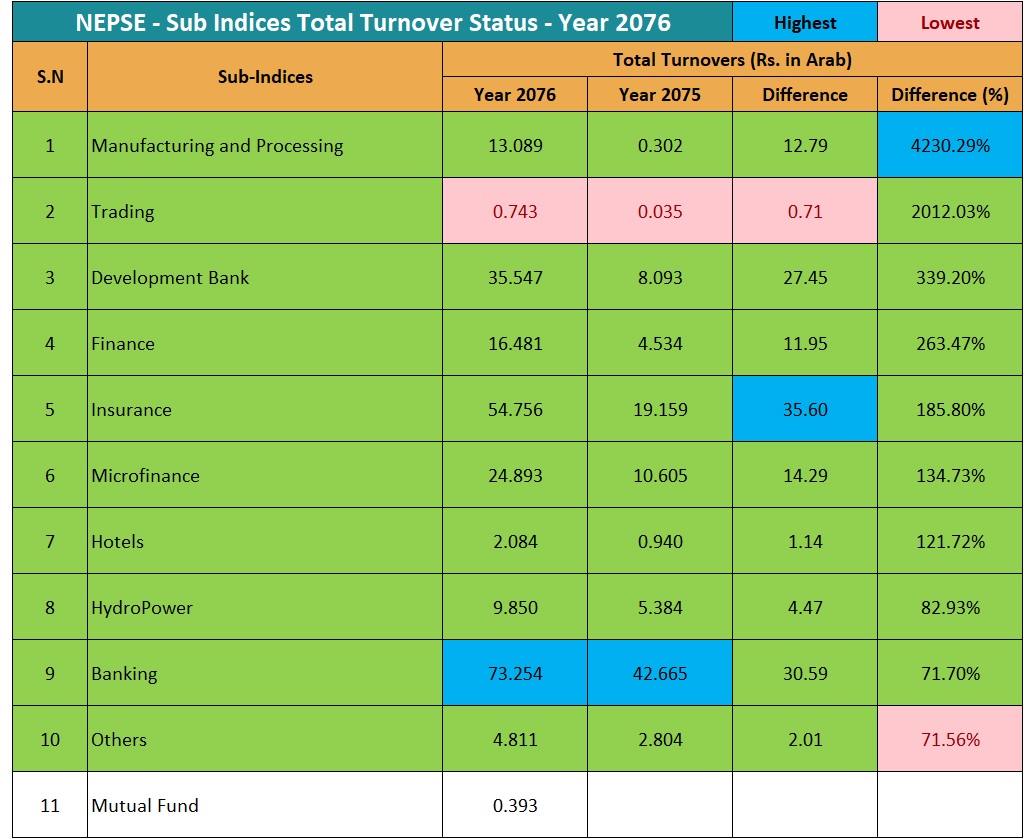
In the last year, stock trading of manufacturing group increased intensively. The group that logged trading amount of Rs 300 million in the previous year increased by Rs 12.79 billion to Rs 13.08 billion.
Compared to previous year, trading subgroup increased by 20 times, development bank by 3 times, finance by 2 times, insurance by 1.85 times, microfinance by 1.34 times and hotel by 1.21 times.
In terms of transaction amount, banking subgroup is leading other groups. The group logged transaction amount of Rs 73.24 billion in the last year which was Rs 42 billion in the previous year.